
DonorSnap Analytics – Dashboards
The DS Analytics Dashboard tool allows you to create meaningful snapshots of your data. Create a dashboard for each aspect of your organization to compile related data, whether that be memberships, capital campaign progress, volunteer activities, or general fundraising stats. Your dashboard will give you critical insight into the most meaningful pieces of your organization at a glance.
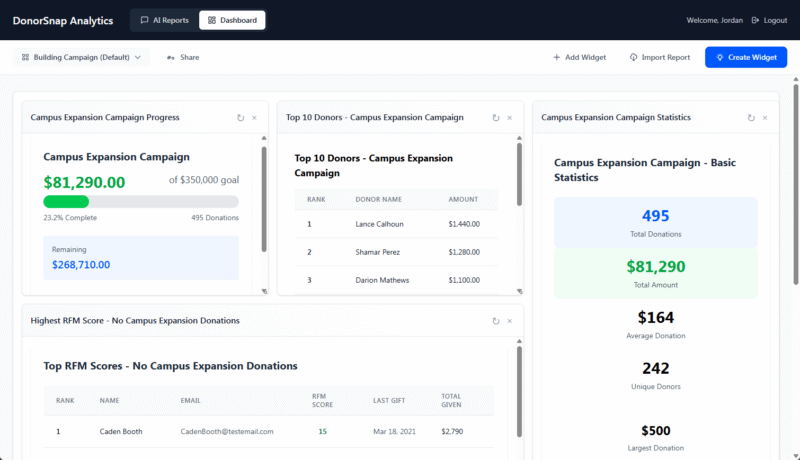
Widgets
Each dashboard is made up of a collection of widgets. At a basic level, a widget is just a saved report. They can be resized and rearranged as needed. Widgets are not limited to just displaying tables of text and numbers. They can display graphs and charts of all different kinds, progress bars, search tools, and more. Want to know if a certain widget you want to see can be created? Just ask this AI tool to create it to see it in action.
Click the blue “Create Widget” button to get started. You’ll be given the opportunity to submit a text based prompt. Just tell the AI what you want to generate and preview the results. If it’s not exactly what you want, try rephrasing your prompt a bit or adding some specificity and preview it again. If you have certain styling or elements you want to include, such as a blue colored pie chart, add those details to your prompt as well. If you don’t mention exactly what you want, the tool will make some assumptions and choose the most appropriate method of displaying the data.
The “+ Add Widget” allows you to copy a widget that is already in use on one of your dashboards. This makes it easy to create a master dashboard highlighting the most important widgets of all of your dashboards.
Click the “Import Report” button to create a widget based on one of your Saved Reports from the AI Reports tool.