
DonorSnap Analytics – AI Reports
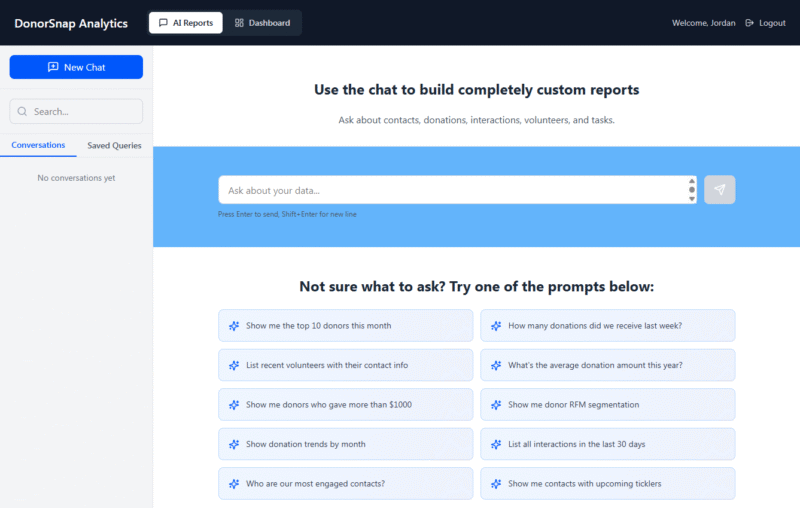
The AI Reports tool uses the AI chat interface to build your custom report. Get started by describing what you want your report to be and press enter. The AI will interpret your question and build a query based on it’s understanding of what you want to see.
If the results aren’t exactly what you want, for example, you wanted to include the email addresses, then say that in your follow up response. The system is smart enough to continue the conversation and tweak your report to now include the email address. Keep going with your conversation until you have exactly what you need.
Once you have the report just right, export the results to .csv or save the query so that you can run it again in the future. Saved queries can also be used to create a dashboard widget.
If you need to build another report that is unrelated to the one you just created, click the “+New Chat” button to start a new conversation. If you change directions or focus in a single conversation, your previous prompts may affect the results in an unintended way.
Explain the Results
If something doesn’t seem right or you are having trouble getting the data you want, click the “Explain Results” button at the bottom of the results. This will open a box explaining how this query is working in detail. It will tell you the fields it used to find your target segment and how it ran the report.
At the bottom is a section for “Key Assumptions & Clarifications”. This section may identify where your expectations are different, and you can give a follow up command to change the report.
Build Comprehensive Reports: Multi-Table
DS Analytics is not limited to one activity table (Donations, Interactions, etc.) at a time like DataMiner Platinum is. You can ask questions that span multiple activity tables in very specific details. For example:
- Give me everyone that volunteered as a first time tutor last year along with how many hours they tutored that also gave to the building campaign this year and how much they gave.
- How much money for the Capital Campaign did I raise this year from the people that have an interaction record with the InteractionType of “Site Visit”
Build Comprehensive Reports: Sub-Queries, Nested Queries, or Merging Queries
If you need a report that compares multiple donation records for a contact, that would have typically required multiple reports. Here’s a few possible examples:
- People that gave to both the General Fund and the Building Fund, but exclude the people that only gave to one or the other.
- Donors that donated in 4 out of the last 5 years.
Build Comprehensive Reports: Donors and Non-donors at the same time
If you have detail donation criteria, but want to also include people that have never made a donation, that is also possible with AI reports. The same is true for interaction or other activity tables. The results can include detailed donation information for the donors, but still include non-donors in the results.
- People that have donated to the Annual Fund this year, or have never donated at all.
- People that attended an event in the past or have never attended but live within 30 miles of 53029
Tips
- Chat with this tool just like you would talk to a person.
- Add clarification to your conversation as needed. If you forgot to include a field, just tell it to add it in. You don’t have to start over with your question
- If you want to manipulate the data in some way like combine the first and last name fields into one column, just say so.
- Change the column titles, sorting, or column order as needed.
- If you are finished building a report and want to build another one, start a new conversation.
- Give it some context when necessary. Since every organization is different, you may need to specify how you are tracking things to get the results you want. For one organization a “Core Supporter” may be a large donor, but for another organization it may be the people that have the most interactions. The more information you add, the better it will understand what you are looking for.
RFM Reports
For advanced analysis of your donors and their potential to give, try running an RFM report. This acronym stands for Recency, Frequency, and Monetary. A number score will be generated based on when their last donation was, how often they have donated in the past, and the amount of those donations. Want to know more about how RFM is calculated in the AI Reports tool? Just ask about it in a chat.
Related Pages
Ideas for reports and dashboards
DonorSnap Analytics
DonorSnap Analytics Training Webinar
DonorSnap Analytics – Dashboards