
DonorSnap Analytics
Build completely custom reports via chat interface.
This product is currently available in it’s beta stage. If you run into any issues while trying it, please contact [email protected].
You don’t have to be a computer expert analyze your data in the way you want. Use the AI chat interface to describe the reports, graphs, and charts you want to build. Explain what you want to see in a sentence or two and let the system write the code for you.
The DS Analytics interface includes two tools:
1) AI Reports
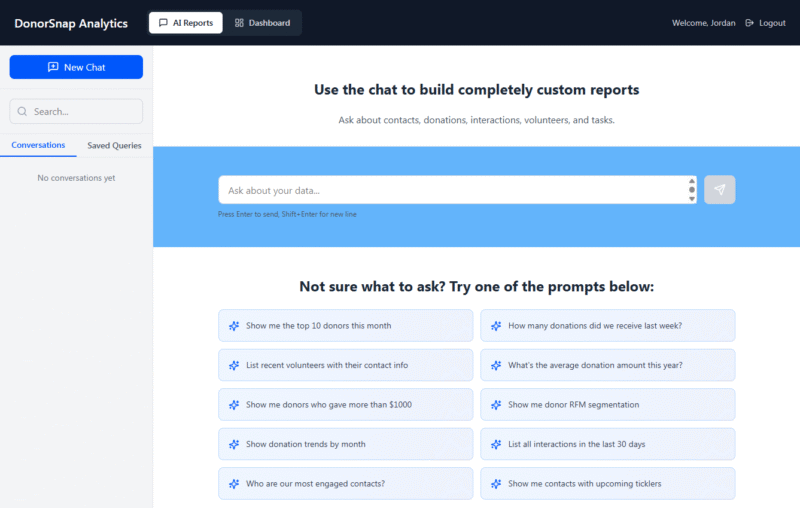
Use this tool to build a report that gives you a .csv spreadsheet to download. Have a chat conversation to build your report. If it doesn’t come out the way you want, tell it to make the changes you want until you get it just right. Reports can be saved so that you can return later and run it again easily.
Learn more about the AI Reports tool.
2) Dashboards
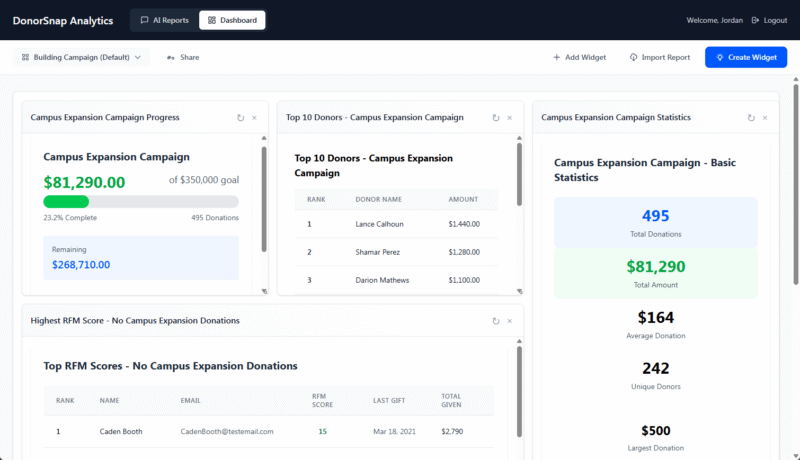
Build a dashboard filled with reporting and analytics widgets. Display the information as graphs and charts so that you can easily review a snapshot of your data whenever you need to. Create a dashboard for a 3 year long campaign or for a general overview of your organization’s donation history. Keep a close eye on your volunteer activity or interactions with your organization.
Learn more about the Dashboards tool
Data Security
This product uses third party AI tools to write report and SQL code. DonorSnap does not share your database records with these tools in any form. Only field names and structure are shared. The AI tools write the query code and provide it back to DonorSnap where it is run securely using your data for the final generated report.
Related Pages
Ideas for reports and dashboards
DonorSnap Analytics – AI Reports
DonorSnap Analytics – Dashboards